The Book of Why- The New Science of Cause and Effect
Title: The Book of Why- The New Science of Cause and Effect
by Judea Pearl and Dana MacKenzie
-
many of the review text were from here URL
- INTRODUCTION Mind over Data 1
- “If causation is not correlation, then what is it? “
- “well articulated discussion of causal inference - what it is, what the available tools are (RCTs, IVs, matching, etc), how they have changed over the years, and how they could be improved. The bits that tell the history of causal inference are especially illuminating;””
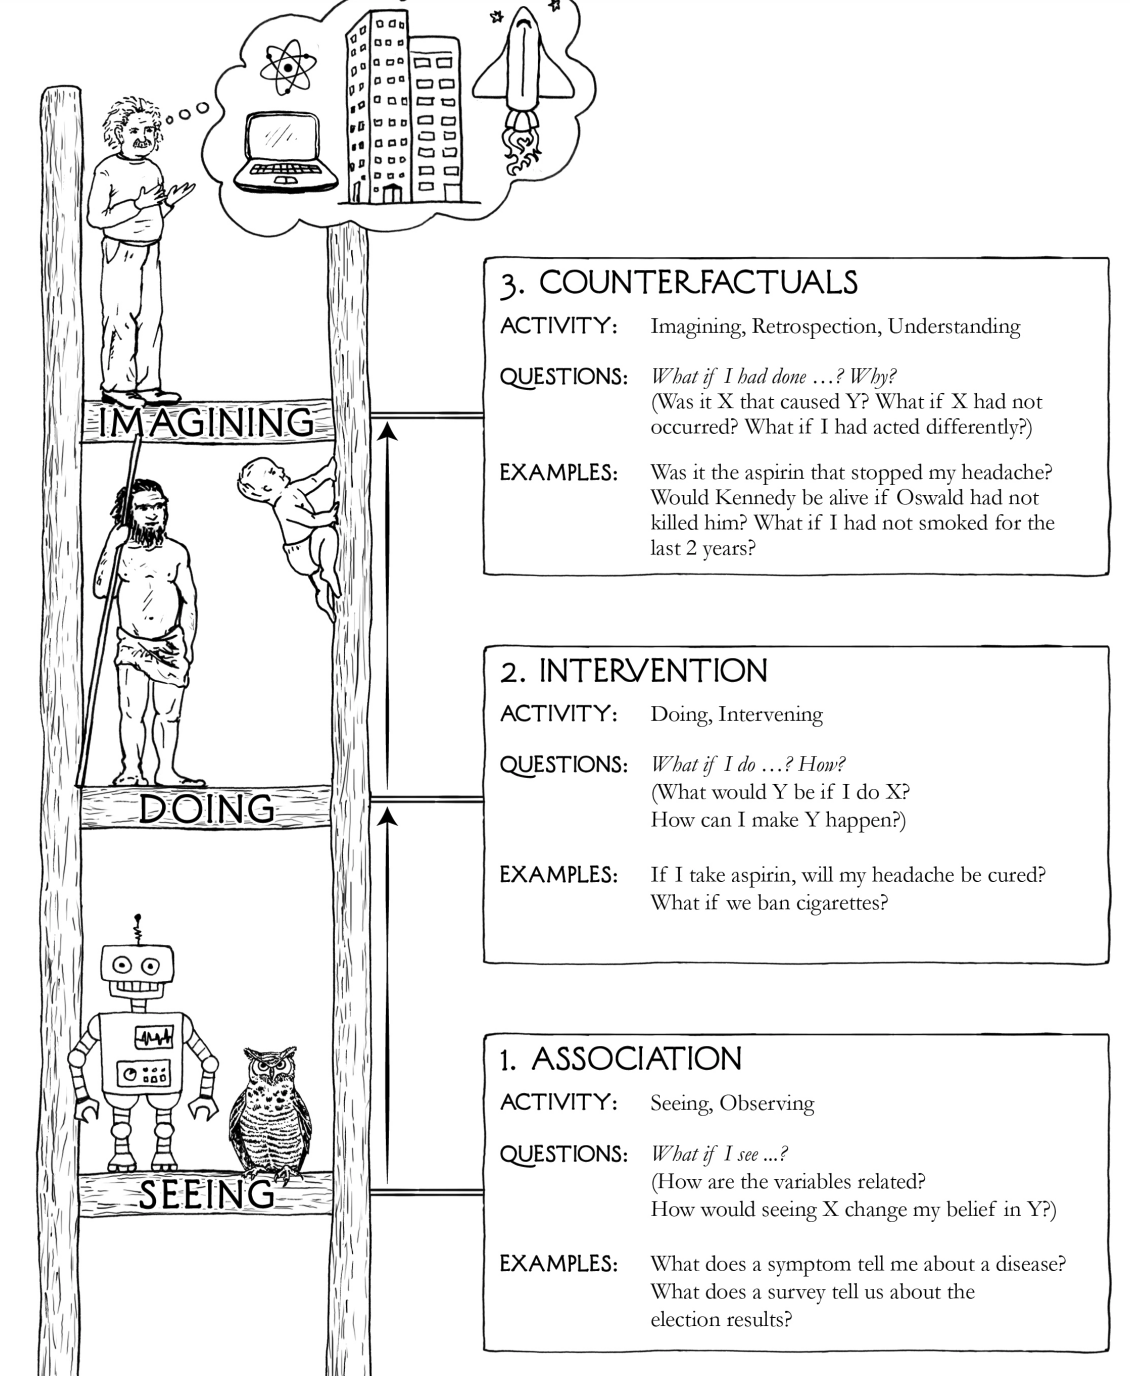
- CHAPTER 1 The Ladder of Causation 23
- three distict levels: seeing, doing, and imagining.
- “Various options exist for causal models: causal diagrams, structural equations, logical statements, and so forth. “
- “Methods for extracting causal conclusions from observational studies are on the middle layer of Pearl’s Ladder of Causation, and they are expressed in a mathematical language that extends classical statistics and emphasizes graphical models.””
- CHAPTER 2 From Buccaneers to Guinea Pigs: The Genesis of Causal Inference 53
- review the history of statistics
- review the inventor of path digram: Sewall Wright
- “The use of graphical models to determine cause and effect in observational studies was pioneered by Sewall Wright, whose work on the effects of birth weight, litter size, length of gestation period and other variables on the weight of a 33-day-old guinea pig”
- “Pearl defines a causal model to be a directed acyclic graph that can be paired with data to produce quantitative causal estimates. The graph embodies the structural relationships that a researcher assumes are driving empirical results.””
- CHAPTER 3 From Evidence to Causes: Reverend Bayes Meets Mr. Holmes 93
- review Bayesian networks
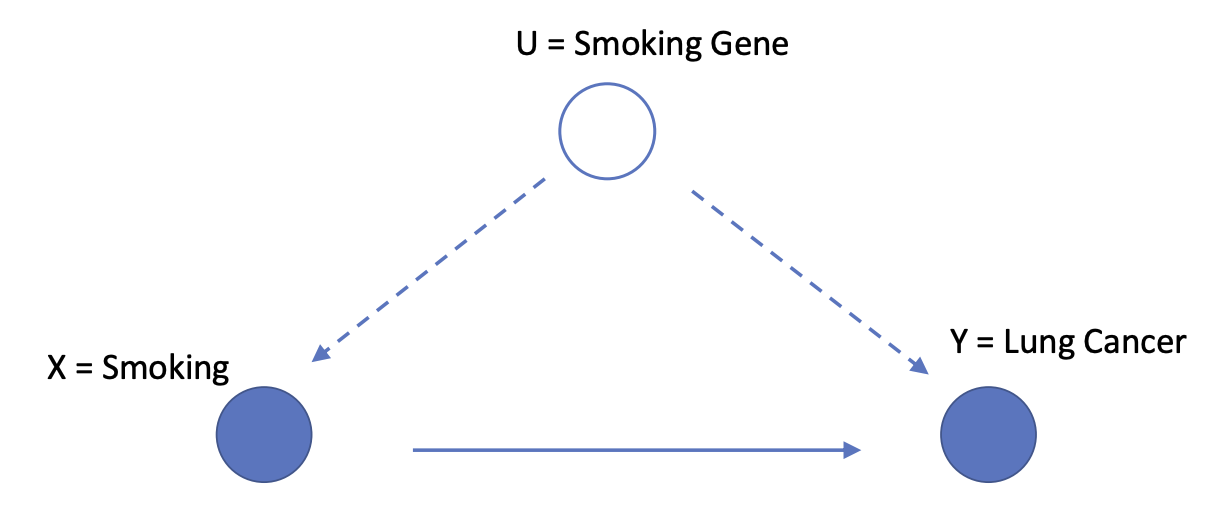
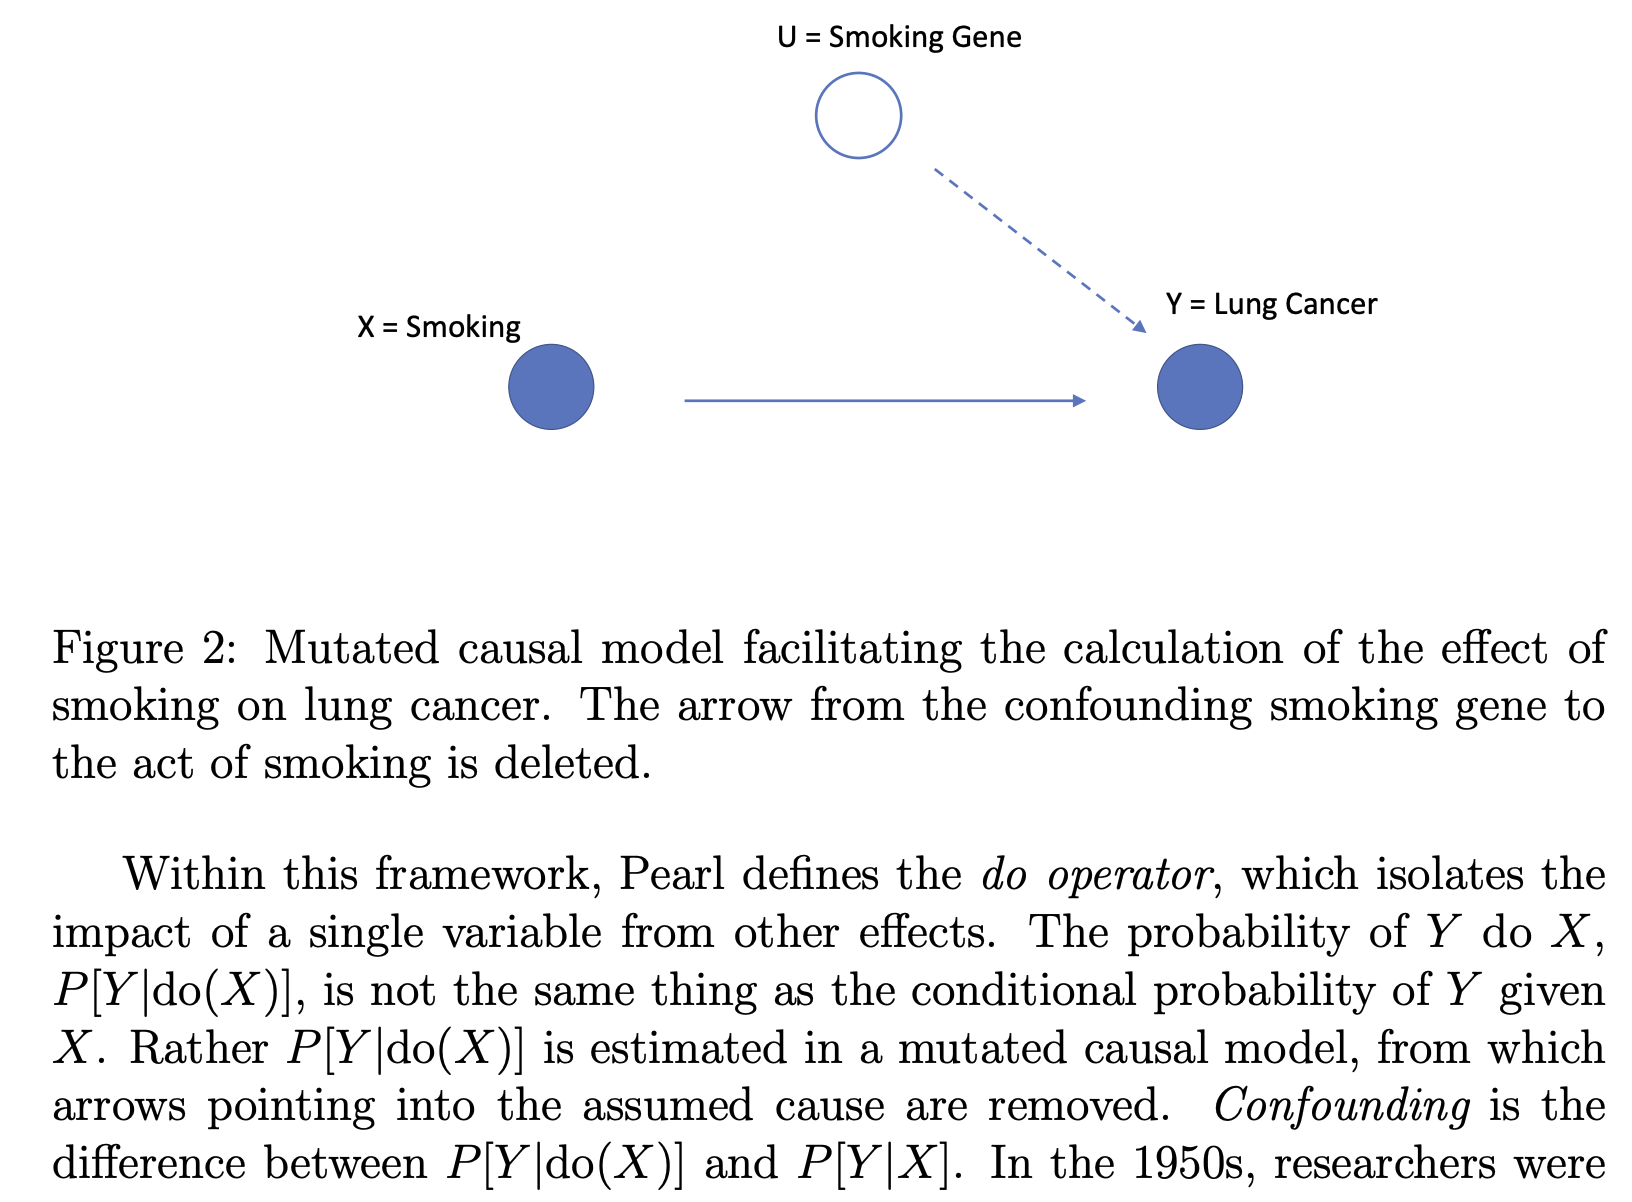
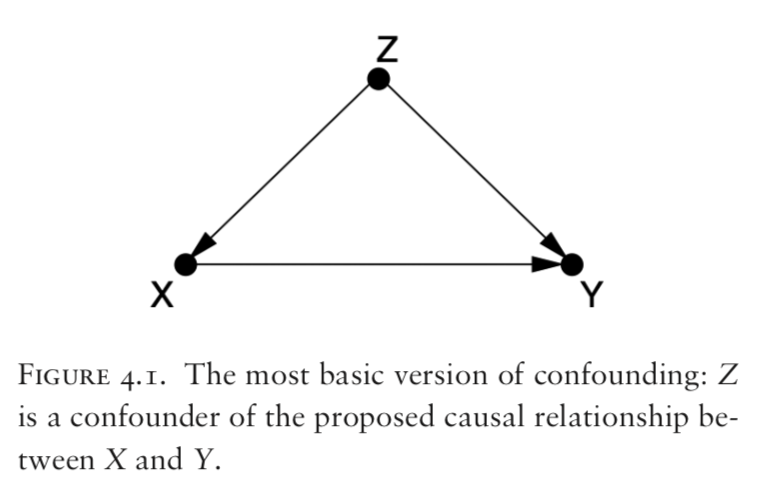
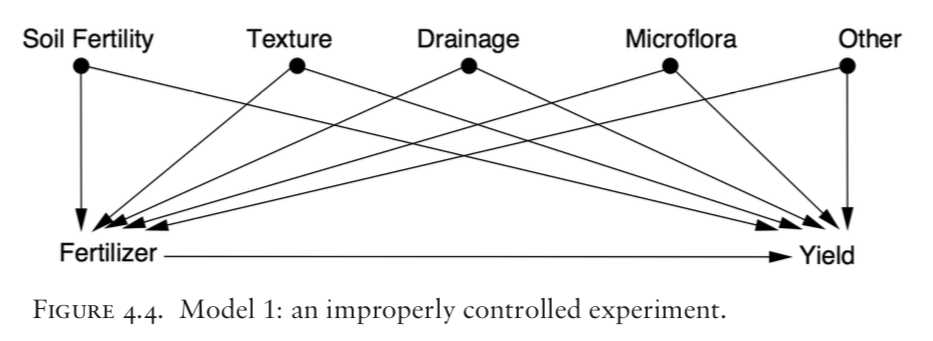
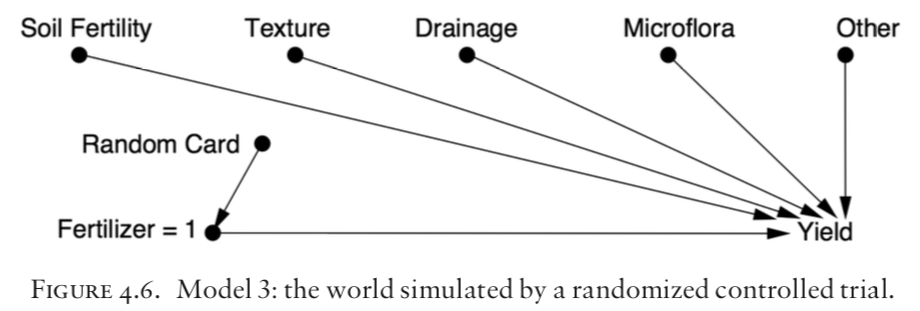
- CHAPTER 4 Confounding and Deconfounding: Or, Slaying the Lurking Variable 135
- review the major casual inference strategy: randomized controlled trial (RCT)
- “The structure of the graphical model, including the identification of vertices as mediators, confounders, or colliders, guides experimental design through the identification of minimal sets of control variables”
- CHAPTER 5 The Smoke-Filled Debate: Clearing the Air 167
- unable to use RCT to answer “the smoke debate”
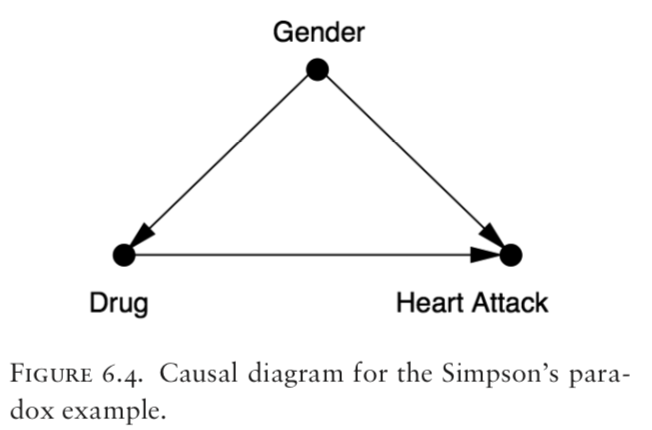
- CHAPTER 6 Paradoxes Galore! 189
- a chapter of paradoxes: the Monty Hall paradox, Simpson’s paradox, Berkson’s paradox and others.
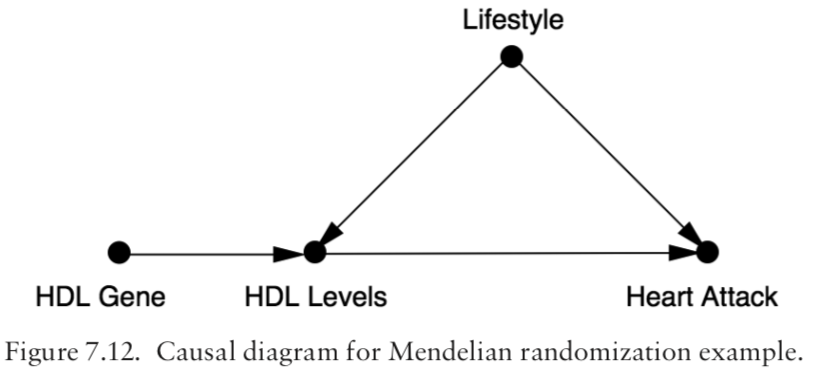
- CHAPTER 7 Beyond Adjustment: The Conquest of Mount Intervention 219
- explains the “causal inference engine”: that produces yes/no answer and estimation of proportion contribution
-
important patterns in CDM include: back-door adjustment, front-door adjustment, and instrumental variables.
- The graphical approach to causal inference that Pearl favors has been influential, but it is not the only approach.
-
CHAPTER 8 Counterfactuals: Mining Worlds That Could Have Been 259
- Another influential model: “Neyman–Rubin potential outcomes model. In the language of medical randomized control trials, a researcher using this model tries to quantify the difference in impact between treatment and no treatment on subjects in an observational study. Propensity scores are matched in an attempt to balance inequities between treated and untreated subjects.” Since no subject can be both treated and untreated, however, the required estimate of impact can be formulated as a missing value problem.
- Rubin model as missing data task.
-
Three basic assumptions of Rubin’s model: (1) stable unit treatment assumption, (2) consistency assumption and (3) ignorability assumption.
-
“Other researchers favor models by James Heckman, whose concept of “fixing” resembles, superficially at least, the do operator that Pearl uses.”
-
More from Statist. Surv. Volume 3 (2009), 96-146. Causal inference in statistics: An overview, by Judea Pearl illustrated using a general theory of causation based on the Structural Causal Model (SCM) described in Pearl (2000a), which subsumes and unifies other approaches to causation, and provides a coherent mathematical foundation for the analysis of causes and counterfactuals.
- In particular, the paper surveys the development of mathematical tools for inferring (from a combination of data and assumptions) answers to three types of causal queries:
- (1) queries about the effects of potential interventions, (also called “causal effects” or “policy evaluation”)
- (2) queries about probabilities of counterfactuals, (including assessment of “regret,” “attribution” or “causes of effects”) and
-
(3) queries about direct and indirect effects (also known as “mediation”).
- Finally, the paper defines the formal and conceptual relationships between the structural and potential-outcome frameworks and presents tools for a symbiotic analysis that uses the strong features of both.
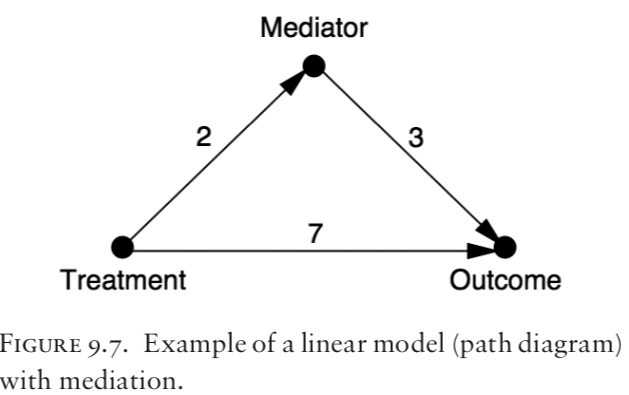
- CHAPTER 9 Mediation: The Search for a Mechanism 299
- Total effect = direct effect + indirect effect ???
-
Total effect (x=0 -> x=1 ) = NDE(x=0-> x=1) - NIE(x=1 -> x=0)
-
CHAPTER 10 Big Data, Artificial Intelligence, and the Big Questions 349
- Some other comments from here
- “Pearl promotes his extension of probability calculus and nonparametric structural equation models (directed acyclic graphs or DAGs) as the solution to the problem of inferring causes from observational data. “
-
“f you have good subject knowledge about a research topic, you will have an understanding of the dependencies between relevant variables and you can use graphical methods as one of the tools to clarify the implications of the model, but that’s really it.”
-
“the differences between these approaches to causal inference are far less important than their simmilarities. Support for this includes a construction by Thomas Richard and James Robins incorporating counterfactuals into graphical cause-and-effect models, thereby unifying various threads of the causal inference literature. [“Single world intervention graphs (SWIGS): A unification of the counterfactual and graphical approaches to causality.” April 2013.] “
- “Results based on a causal model are no better than its underlying assumptions. These assumptions can represent a researcher’s knowledge and experience.”
- ” However, many scholars are concerned that model assumptions represent researcher bias, or are simply unexamined. David Freedman emphasizes this: Assumptions behind models are rarely articulated, let alone defended. The problem is exacerbated because journals tend to favor a mild degree of novelty in statistical procedures. Modeling, the search for significance, the preference for novelty, and the lack of interest in assumptions—these norms are likely to generate a flood of non-reproducible results.”